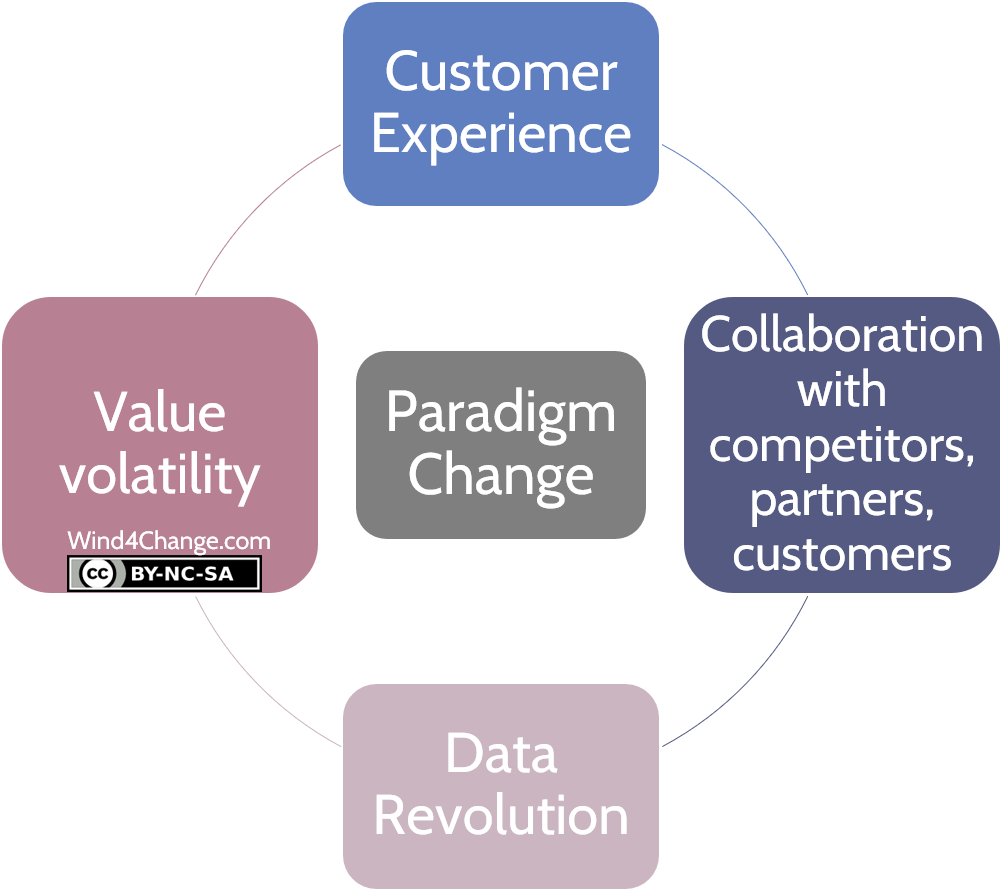
Data Revolution: Digital is more than the emergence of new disruptive technologies. It also involves a change of paradigm. Indeed, the third one is the switch from Data as planned and segregated inputs to Data everywhere, critical to customer journey and to empower intelligence of products.

The Data Revolution: a Paradigm change with Digital
Data is the new oil.

And you need to refine it to use it: it is not just a bigger and more complex amount of data to manage empowered with disruptive technologies. Really, it is a change of Paradigm.
From planned measurements to a deluge of data coming from everywhere and used everywhere
Traditionally, data was produced through a variety of planned measurements (from customer surveys to inventories) that were conducted within a business’s own processes (manufacturing, operations, sales, marketing). Then the generated data was used for measuring, forecasting, and deciding.
Today, we are facing a deluge of data. As a matter of fact, most data available to businesses is not generated through any systematic planning like a market survey. Instead, it is being generated in unprecedented quantities from every conversations, interactions, or process inside or outside these businesses.
Data are becoming the lifeblood of every departments and a strategic asset to be developed and deployed over time. Surely, Data are not any longer confined to the scope of specific business intelligence units.
Smart connected objects are playing a role more and more important when talking about Data. Indeed, they are data-driven and data-producing devices. Therefore, all the functions of your organization must be data-augmented.
Truly, Data is becoming the main and most valuable assets within all your business units and processes. Therefore, you should manage them as a critical resource.
How to adapt to face the Data Revolution coming with Digital?
The basics of the Data Revolution are:
- Firstly, to combine the right data, this includes breaking the data silos in the company and to effectively collaborate with data partners.
- Secondly, to turn your Data into an asset to generate long-term value making new kinds of predictions, uncovering unexpected patterns in business activity and unlocking new sources of value.
But the challenge is so big that you need to adopt a structured approach.
The 4 pillars to turn your data into asset and value
Insight: Understanding customers’ psychology, their behaviors and the impact of business actions
By revealing previously invisible relationships, patterns and influences, customer data can provide an immense value to businesses:
- Firstly, Data can provide insights into customer psychology:
- How are my brands or products perceived in the marketplace?
- What motivates and influences customer decisions?
- Can I predict and measure customer word of mouth?
- Secondly, Data can reveal patterns in customer behavior:
- How are buying habits shifting?
- How are customers using my product?
- Where is fraud or abuse taking place?
- Thirdly, you can use Data to measure the impact of specific actions on customers’ psychology and behavior:
- What is the result of my change in messaging, marketing spending, product mix, or distribution channels?
Targeting: Narrowing your audience, knowing who to reach and using advanced segmentation
By narrowing the field of possible audiences and identifying who is most relevant to a business, customer data can help drive greater results from every interaction with customers:
- In the past, customers were often divided into a few broad segments for targeting based on factors like age, zip code, and product use.
- Today, advanced segmentation schemes can be based on much more diverse customer data and can produce dozens or even hundreds of micro-categories. How you target a customer can change in real time as well. Indeed, they are assigned to one segment or another based on behavioral data such as which e-mails they clicked on, rewards they redeemed or content they shared.
- Ideally, you should include customer lifetime value as one metric for targeting customers based on their long-term value to the business.
Personalization: Treating different customers differently to increase relevance and results
By tailoring their messaging, offers, pricing, services, and products to fit the needs of each customer, businesses can expand the value they provide.
British Airways has launched a service personalization program known internally as Know Me. Indeed, its purpose is to combine various data to build a “single customer view” that will assist airline crew to connect more personally with each customer.
The program works only because the data analytics are linked to the judgment and “emotional intelligence” of the British Airways service staff. To illustrate, staff can deepen their awareness of fliers’ personal needs and preferences using Know Me data. In addition, the organization empowers the staff to make their own observations and record data that helps personalize future trips. This feedback loop helps the company propose more relevant offers to each customer and provide personalized acknowledgement and service during a flight.
This can include:
- Recognizing a VIP business traveler (even when traveling in coach class with family) so that service staff can welcome and thank them and offer a glass of champagne.
- Providing discreet assurances to a customer who has previously indicated they have a fear of flying.
Context: Relating one customer’s data to the data of a larger population
By providing a frame of reference and illustrating how one customer’s actions or outcomes stack up against those of a broader population, context can create new value for businesses and customers alike. Really, putting data in context is at the heart of the “quantified self” movement. One evidence is the customers’ rising interest in measuring their diet, exercise, heart rates, sleep patterns, and other biological markers.
Nike was one of the first companies to tap into this trend with its Nike+ platform, which originally used in-shoe sensors. Then the Nike Fuel wristband, and later mobile software apps. At each step of its development, the company has designed Nike+ to let customers collect their data and share them with their online communities. Nike customers who track their running data don’t just want to know how they performed this day. They also want to monitor today’s performance with their own performance over the last week or month, to the goals they have set and to the activity of friends in their social network.
Mastering causality in data-driven decision making
Because convergent experimentation needs to measure causality, it needs to meet the key principles of formal scientific experiments:
- Causal hypothesis, so that you have an independent variable (the cause) and one or more dependent variables (the effect)
- Test and control groups, so that you can see the difference between those who are exposed to your stimulus and those who aren’t
- Randomly assigned participants, so that an external factor doesn’t influence the outcome of your test group
- Statistically valid sample size, so that the differences you measure can rise above the noise of random fluctuations
- Blind testing, so that you avoid the Hawthorne effect, where those involved in the experiment unintentionally influence its outcome
Avoid failing in misunderstanding about Big Data
The Algorithm is not all
- Firstly, check the quality and accuracy of the data: how are they collected, what is the margin of error?
- Secondly, keep in mind potential biases with the algorithm. In fact, they may integrate biases coming from their designers and the way they think…
- Thirdly, all start with asking the good questions: “If you start with the data, you will end with the data. The question that I ask my teams all the time is, ‘What question are we trying to answer?'” (Tariq Shaukat, chief commercial officer of Caesar’s Entertainment).
There is more value to get than pure correlation
If you are only making predictions, data correlation is enough. But if you are looking to change the precondition, you need to know if there is causality as well.
Good Data do not need to come from Big Data
Data do not always need to be “big” (i.e. complex, unstructured and huge) in order to be useful to a business. You can derive powerful insights from the analysis and application of traditional data such as customer clickstream behavior. To illustrate, where do customers click on a website, scroll down the page, spend more or less time, put things in shopping carts, etc.
Master data related digital technologies
Of course, you should master with the skilled work force the Digital Technologies supporting the Data Revolution:
- Big Data
- AI
- IoT
- Cloud computing
See my first post of this series to have more information about Data related Digital Technologies.
What’s next? Learn more about Digital, the other new paradigms and the disruptive technologies
Check my other posts on Digital and the new paradigms:
- Customer Experience
- Coopetition and platform business model
- Data revolution (this post)
- Value volatility
And how Agile fits in the digital picture.
Check my post about the disruptive technologies that this article refers to.
Do you want to learn more about the Data Revolution? Here are some valuable references
Excellent books about Digital
- The Digital Transformation Playbook
- The website of the author, David L Rogers.
- Reinventing the Product
