
The definition of cost of delay is the quantity of benefits you lose or gain if your product is late or early to enter the market. Furthermore, Don Reinertsen elaborated on this concept introducing the Weighted Shortest Job First (WSJF) that is calculated by dividing the Cost of Delay by the duration to build and deliver the product to the market. So, the cost of delay combines value and urgency and its calculation is expressed by unit of money divided by a unit of time, typically per month or per week. At last, Black Swan Farming renamed the WSJF, CD3 or Cost of Delay Divided by Duration, to keep Cost of Delay in the name and to stress that the divider is the duration. Note that we are talking here about profit not revenue.
- Examples of Cost of Delay
- How to calculate benefits
- Examples of Cost of Delay Divided by Duration (CD3) also called Weighted Shortest Job First (WSJF)
- What are the advantages of the CD3
- Case Study on Cost of Delay: Maersk Line
- SAFe Weighted Shortest Job First (WSJF)
- Beyond CD3 and SAFe WSJF
- WIP vs Cost of Delay: is Cost of Delay the same as WIP (Work in Progress)
- What’s next? Learn more about Agile at Scale
- Do you want to learn more about Cost of Delay Divided by Duration (CD3) and Weighted Shortest Job First (WSJF)? Here are some valuable references
Examples of Cost of Delay
6 months of delay can reduce a product’s profit by 33%.
The cost of delay depends on the life-cycle of the profits of a given product and the impact of postponing the entry to the market.
Short life-cycle with a profit peak impacted by delay
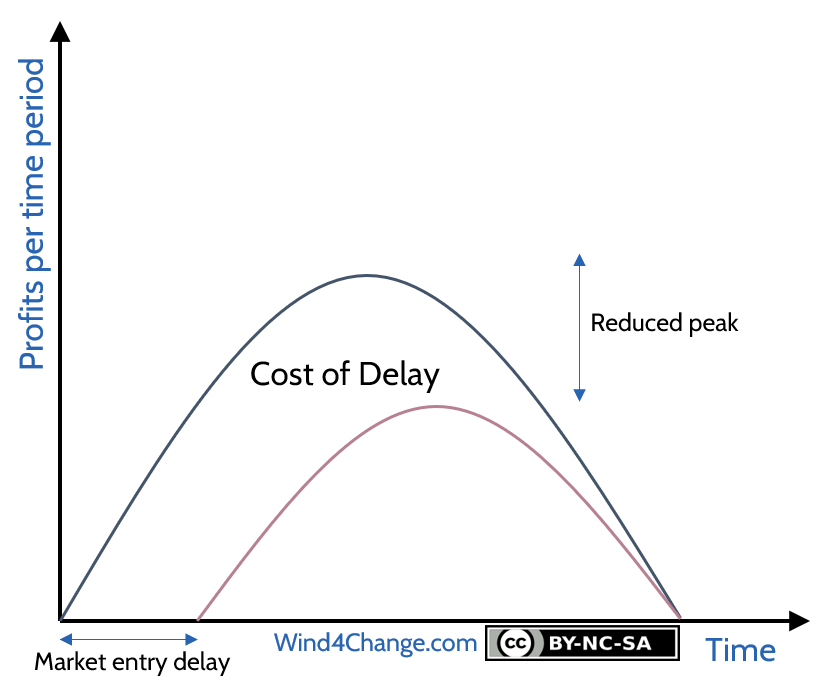
The life-cycle of a product may be short. So, profits ramp up to the peak then quickly decline, as the value added becomes standard for customers with the competitors catching up or the market moving to something new. To illustrate, in the fashion business that is a fast-moving business, if you are late, the profits massively reduce.
Long life-cycle with a profit peak impacted by delay
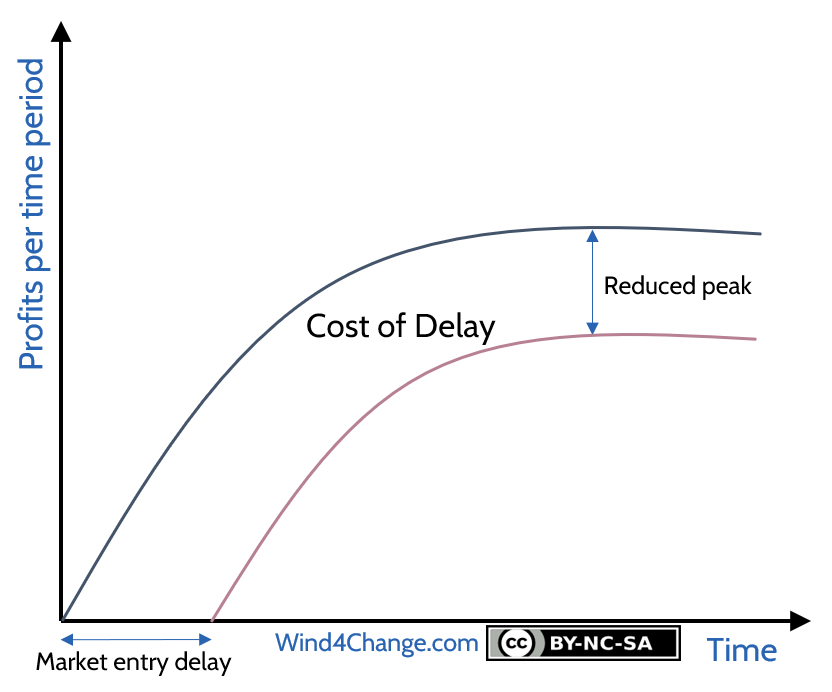
Another life-cycle profile is where there is a first-mover advantage, making for the competition difficult to catch up. All services involving a network effect like social networks are an example. So, in this case, even if the profits last, there is a long term decrease of profits that cannot compensate.
In the very specific case of monopoly, you do not have a long term decrease but that is an exception.
Note that the Cost of Delay related to the form of the curve may change with delay. So, compute several estimations to generate an average curve. For instance, missing a special event like a major trade show may have a non linear impact. If missed, the impact may be huge, sometimes nearly a year of sales if it is your primary marketing event.
External deadline
Some products, services or features have an external deadline. Truly it is typical with regulation. In this case, delivering too much before the regulation is active, is a waste of resources. The delivery should happen at the last reasonable moment, taking into account a time buffer to secure the delivery. So, the Cost of Delay will start in this scenario at the moment the product, service or feature is due. But it will be equal to zero before.
How to calculate benefits
It is a difficult exercise, but it does not need to be perfect to be relevant. Only big figures matter. In order to cover all the possible benefits, you can consider them in 4 types, some relate to revenue and other to costs:
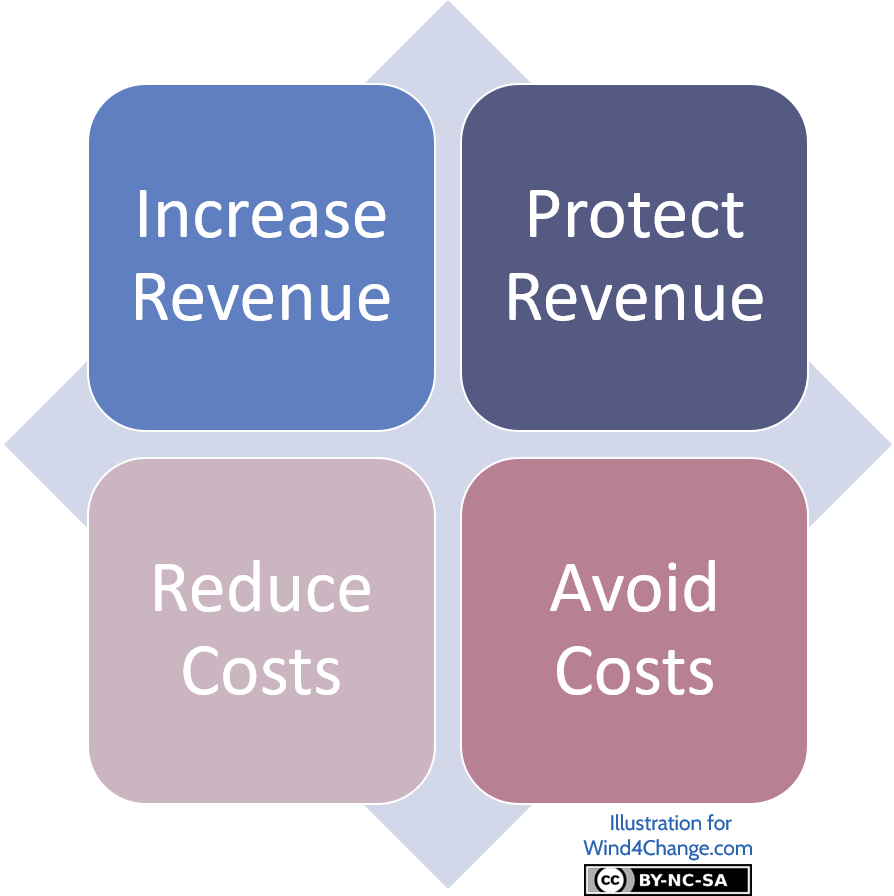
- Increase Revenue by increasing sales to existing customers with more products, services or better margin, or new customers. This comes with differentiating features and disruptive innovation.
- Protect Revenue by proposing improvements at least to keep up with the competition. But customers are not ready to pay more and this is only a defensive position.
- Reduce Costs by reducing wastes and increasing the outcome for the same output. Typical examples are all improvements coming with Lean including automation.
- Avoid Costs that have not already occurred. It is a proactive approach similar to the one to reduce actual costs and usually covers risks.
Examples of Cost of Delay Divided by Duration (CD3) also called Weighted Shortest Job First (WSJF)
In order to demonstrate how the CD3 can improve the prioritization and the value delivered by an organization, let’s review a simple example with 3 features. For each, we have a Cost of Delay as a cost per time period, here it will be per month, a duration to build the feature in months also and finally the CD3 as the result of the calculation of the Cost of Delay divided by the duration.
| Feature | Cost of Delay per month | Duration | CD3 |
|---|---|---|---|
| A | 1 | 4 | 0.25 |
| B | 3 | 1 | 3 |
| C | 6 | 3 | 2 |
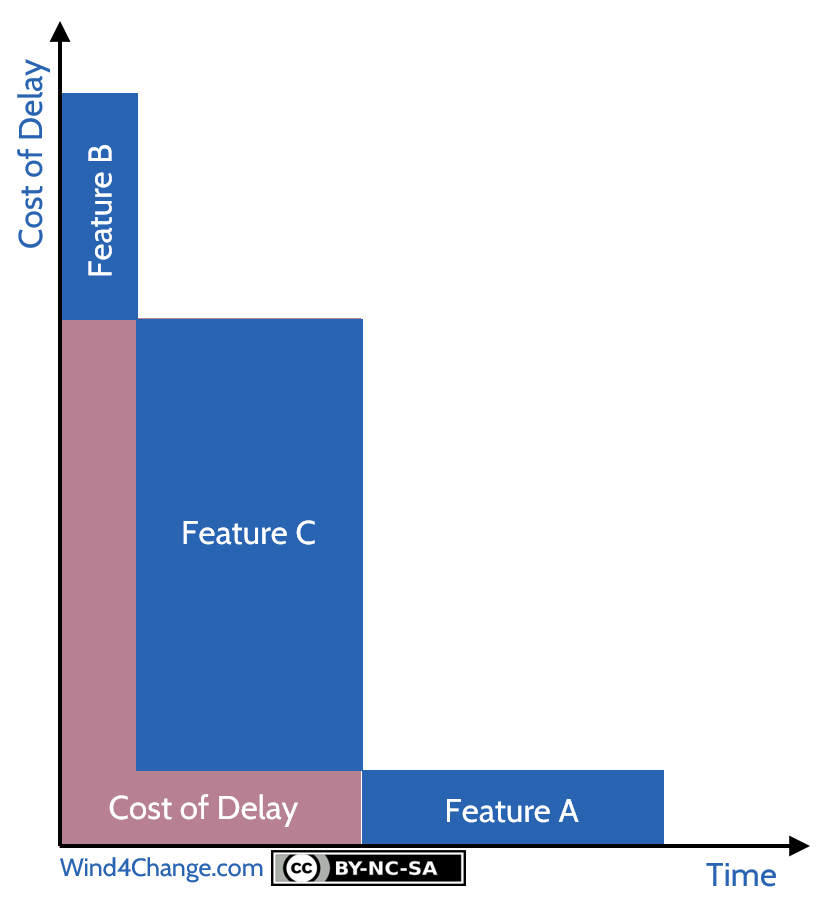
Cost of Delay with FIFO prioritization
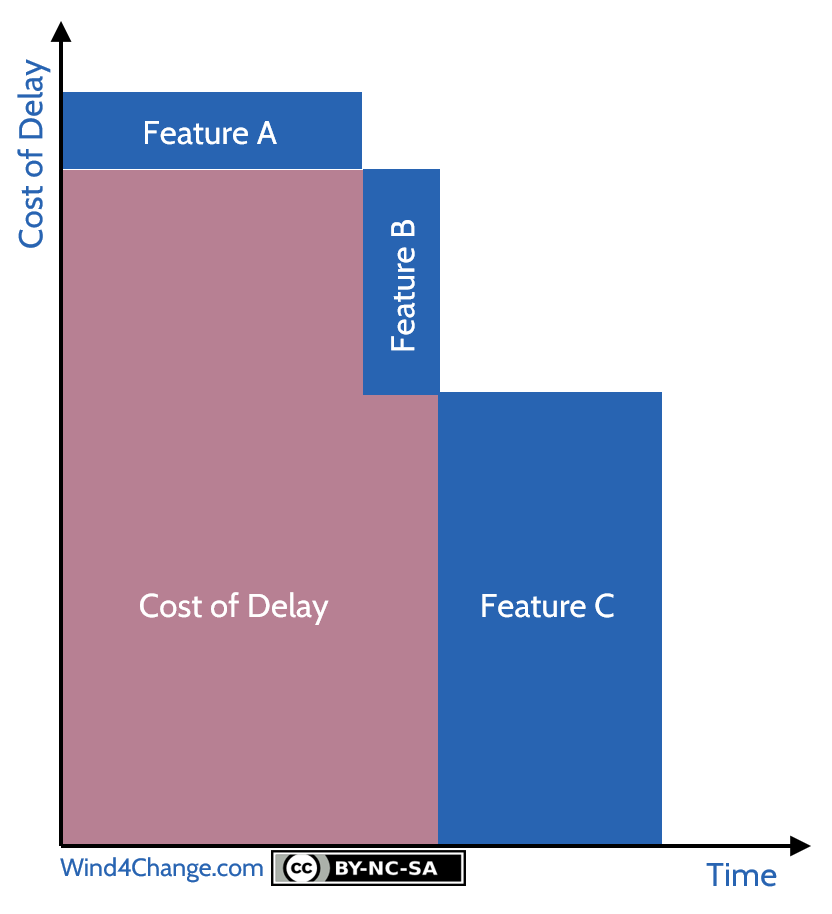
Let’s imagine that we build and deliver the features in the order of arrival in a FIFO (First In First Out) approach. We will first deliver the feature A, while paying in the meantime the cost of delay each month for features B and C. Then we will deliver the feature B, while paying in the meantime the cost of delay each month for feature C. The total Cost of Delay is the pink area in the graph.
Cost of Delay with CD3 prioritization
Now let’s imagine we deliver the features in the order of CD3: feature B, then C and at last A. Here the Cost of Delay we have to pay is much lower and this is obvious in the graphic.
Note that the estimation of the CD3 does not need to be perfect. Clearly, any figure is better than just guessing. In addition, it is better to have a simple model that everybody understand than a more accurate but more complex one that nobody understand.
So to wrap up this demonstration, CD3, as a common metric to all opportunities, allows a comparison of value and urgency of opportunities with different duration. As a result, it maximizes the value delivered in a time period for a given capacity. This is the case in Agile at Scale where we align capacity to a Value Chain.
What are the advantages of the CD3
- First of all, the CD3 makes it possible like other prioritization approaches to base decisions on facts not opinions. Indeed, as Don Reinertsen stressed it, the usual gap of guess-estimation is 1 to 50. In addition to ground decisions in rational, it moves them away from opinions especially from Hippo (highest paid person’s opinion). Indeed, highest paid persons, in other word top managers make also mistakes and as human being they also have cognitive biases. So, they cannot just trust their gut feeling. Furthermore, a factual approach allows to build a consensus.
- In addition, CD3 enables a better prioritization between works as it makes it possible to compare them with a single metric. As a result, you can manage better the queue as you know the cost of pending value.
- At last, a side effect is that requests’ size will decrease. Clearly, this supports a trend coming with Agile to decrease work in progress and time to market.
Case Study on Cost of Delay: Maersk Line
A famous case study around CD3 is the Maersk Line case. Maersk Line is a Danish container shipping company. It is the world’s largest company in this business by both fleet size and cargo capacity with 786 vessels and 31,600 employees.
By implementing Agile & Lean Project Portfolio with in addition CD3, they revolutionized their IT Project Portfolio with amazing results like a 5-10 times ROI increase and a cut by 50% of the time to market.
Specifically, with CD3 they realized that 1 feature was costing $200,000 per week. And this opportunity waited 38 weeks with as a result a lost of nearly $8 million dollars for the organization. They also noticed that the Cost of Delay was quite concentrated on some features. For one of their core system, they noticed that top 25% features in Cost of Delay were standing for thousand times the cost of delay of the lowest 25% features. The ratio between top features and the second slice of 25% of features was 12 and between the top 25% and the third slice of 25% of features was 44.
If you only quantify one thing, quantify the cost of delay.
SAFe Weighted Shortest Job First (WSJF)
SAFe framework integrates the Cost of Delay in a simplified version of the WSJF and the CD3. As a matter of fact, people always have a hard time to compute benefits of opportunities. In addition, they may make the effort for a big initiative but not for smaller but still significant opportunities.
This is where SAFe approach is interesting. Yet, it is less accurate, but it is quite simple and easy to implement. So, it can be a first step and can allow to cover all size of opportunities.
Each opportunity is estimated on a scale, usually the Fibonacci series, over 3 dimensions:
- User-business value:
- What is the relative value of the opportunity to the business?
- How opportunities rank in comparison to each other?
- This can be revenue or cost avoidance.
- Time criticality:
- How does the business value of the opportunity decline with time?
- Is there a fixed deadline and if so, what is the impact?
- Risk reduction-opportunity enablement value
- Does this opportunity reduce a risk ?
- Does it enable new business opportunities?
Note that in order to calibrate the backlog, there should be for each dimension at least a feature estimated to 1. Then, everything cannot be rated at the maximum. When everything is urgent, nothing is urgent!
At last, SAFe uses the size of the work to deliver the opportunities as a proxy for duration. Similarly, it can be evaluated with the Fibonacci series.
Beyond CD3 and SAFe WSJF
CD3 metric and SAFe WSJF do not take into account the alignment with the business strategy. Indeed, you cannot grab opportunities just because of their benefits. They should support your strategy and your resources should remain focused. Yet, SAFe approach with 3 dimensions and Scale evaluation for each, can be enriched with additional dimensions, each supporting pillars of the business strategy. This way, in addition to the financial metric, the opportunities can be evaluated on how they support the business strategy.
WIP vs Cost of Delay: is Cost of Delay the same as WIP (Work in Progress)
While collecting references to back up this post, I noticed they were questions about the difference between the Cost of Delay and the Work in Progress.
The Work in Progress is all the features that are currently under development whatever the step they are in. As soon as the development team has started to work on a feature it is in WIP. In other words, it is an inventory of intermediary products. It is an investment that does not yet generate revenue. So, you want to keep it as low as possible for instance by starting new works only when old ones are completed (Lean and Agile principles).
The Cost of Delay, is the cost of waiting for a given feature and in comparison to the others. So, here it is about features not started yet. Those features are not part of the Work in Progress. Nevertheless, you want to minimize this cost also and make sure that you build first and deliver first the opportunities generating more value.
What’s next? Learn more about Agile at Scale
Check my other posts about Agile at Scale:
- Review my posts on Agile at Scale foundations:
- What are
- What are the team topologies?
- How to synchronize Agile Squads in Agile at Scale when there are dependencies?
- Check another of my posts introducing Agile at Scale that leverages the book “Doing Agile Right”.
- Review my post on the Agile best practices from the GAO the Government Accountability Office from the USA.
- Read my posts on advanced topics around Agile at Scale:
- What are Leagues in Agile at Scale?
- How to design Agile Squads so they are aligned on the Value Chains.
- Why going for horizontal management? What does it mean and what is the value?
- How roles are reallocated with Agile at Scale?
- Check my posts on project management in Agile at Scale
- What is the impact of Agile on Project Management?
- How does Project Portfolio Management change with Agile at Scale?
- Then, how does Cost of Delay Divided by Duration (CD3) contribute to Agile at Scale?
- How does Beyond Budgeting support Agile at Scale?
- Can an Agile Project be fixed price?
- How to manage Release Management in Agile?
- Review my posts on how to forge a good strategy:
- What are competition and competitive advantage?
- What is a good strategy?
Do you want to learn more about Cost of Delay Divided by Duration (CD3) and Weighted Shortest Job First (WSJF)? Here are some valuable references
Cost of Delay Divided by Duration (CD3)
- Post on Cost of Delay Divided by Duration by Black Swan Farming.
- Article on Cost of Delay by Black Swan Farming.
- Post on life cycles of opportunities by Black Swan Farming.
- A good video on Cost of Delay.
- Interview of Don Reinertsen on Cost of Delay.
- The Maersk Line case study on Cost of Delay.
SAFe Weighted Shortest Job First (WSJF)
- Post on Weighted Shortest Job First (WSJF) from SAFe blog.